


At similar usage levels, reach cannot distinguish the leading platforms
Among the online consumers surveyed, 66% use Grab and 64% use Green SM, so many consumers have both apps on their phones. Food delivery shows the same pattern: 53% use GrabFood and 53% use ShopeeFood.
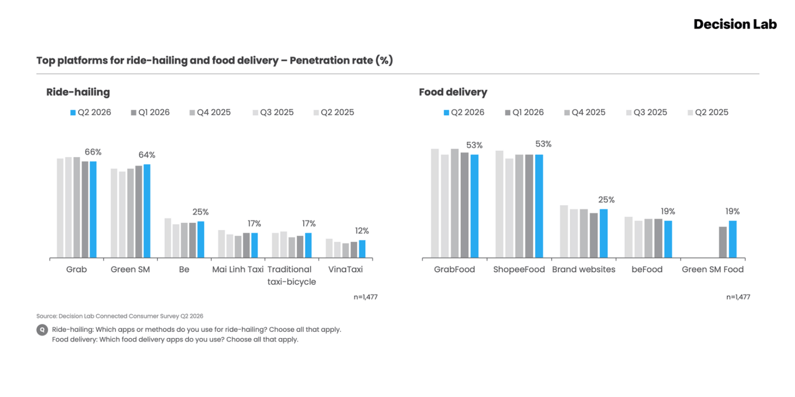
Green SM is gaining ground in ride hailing, while GrabFood and ShopeeFood
continue to share the lead in food delivery.
Decisions on partnerships, investment and where to build a presence often rely on usage figures. At these levels, those figures make very different positions look the same. Usage shows how many people have a platform in their routine; it does not show which one they use most often. And when consumers already have both apps, order the platform they use most often is the clearer indication of where their orders go.
For Vietnam’s leading platforms, usage is a baseline rather than an advantage. It puts a platform into consideration. Preference is the stronger indication of where the first order, the repeat use and the customer data that comes with them are likely to go.
What sets platforms apart is which one each generation uses most often
Food delivery shows this clearly. Gen X and Gen Y share the same preference, with 42% using GrabFood most often and 32% using ShopeeFood. Gen Z is the only generation that uses ShopeeFood most often, at 46% compared with 33% for GrabFood. Gen Z is also less likely to use a brand’s own website most often: 6%, compared with 15% of Gen X.
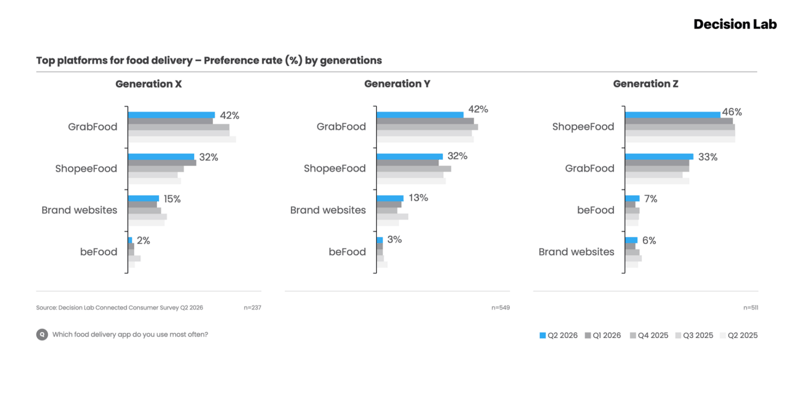
Gen X and Gen Y share the same preferred platform in food delivery;
Gen Z is the only generation that prefers ShopeeFood.
Generational differences do not always divide Gen Z from everyone else. In food delivery, Gen Y’s preference matches Gen X’s; in car ride-hailing, it leans towards Green SM Taxi, as Gen Z does. The dividing line moves from one category to the next, and Gen Y, aged 30 to 45, is where it moves. When Gen Y shares Gen Z’s preferred platform, that preference spans two generations rather than one.
The owned-channel figure adds a further layer. Among older consumers, a brand’s own website still carries part of the relationship. Among Gen Z, the platform they use most often is usually the main point of contact, so more of the relationship with the youngest customers, and the repeat orders that follow, sits with the platform rather than with the brand.
Mr Thue Quist Thomasen, CEO of Decision Lab, noted:
“Reach gets a platform onto the consumer’s screen, but it no longer sets the leaders apart. With Vietnam’s leading platforms used by almost the same number of people, the advantage belongs to the one people return to most often, and our data shows that this differs by generation. Brands that earn a clear role in each generation’s daily routine will turn usage into loyalty.”
Younger generations do not always prefer newer platforms
Online shopping shows why age alone cannot predict a generation’s preferred platform. Shopee is the main shopping platform for 67% of Gen Z, the highest share of any generation, compared with 60% of Gen X and 59% of Gen Y. TikTok Shop is no more likely to be Gen Z’s main shopping platform than Gen Y’s.
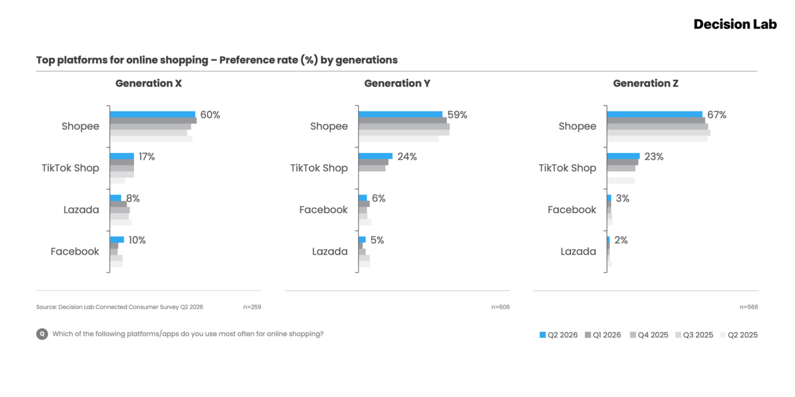
Shopee is the main shopping platform for 67% of Gen Z,
the highest share of any generation.
Gen Z is not simply drawn to what is new. In online shopping, an established platform holds its strongest position with the youngest generation, and in food delivery Gen Z’s preferred platform is ShopeeFood, part of the same ecosystem. For platforms, being newer is not in itself what earns younger consumers’ preference. For anyone planning by generation, age is a useful lens only when it is read category by category: an assumption about Gen Z that holds in one category may not hold in the next.
Preference by generation is what sets Vietnam’s leading platforms apart
Vietnam’s leading platforms are used at similar levels. What separates them is which generation uses them most often, and that answer changes by category: Gen Y can side with either the older or the younger generation, and Gen Z can prefer an established platform as readily as a newer one. A platform’s overall position can therefore differ from its position with the generation that matters most to a brand. The useful question is not how many people use a platform, but whose preferred platform it is, and in which category.
The data captures a single point in time, so it cannot show whether these differences will hold as Gen Z grows older. If they do, the platforms that Gen Z uses most often today will be well placed as this generation makes up a larger share of consumers. That is a direction to track rather than a conclusion, and it is why preference by generation belongs alongside usage in any assessment of Vietnam’s digital platforms.
Ms Nguyen Thi Mai Tram, our Head of Insight Velocity Practice, emphasized:
“The biggest risk in generational planning is assumption. Gen Z does not always pick the newer platform, and Gen Y does not always side with the young. Each category draws its own line between generations, so the only reliable approach is to check it with data, category by category.”
The Connected Consumer data is collected through YouGov Profiles, allowing the same generational analysis to be built for a specific brand, category or audience.
To find out which generation uses your brand most often in your category, arrange a 30-minute data briefing with our team.